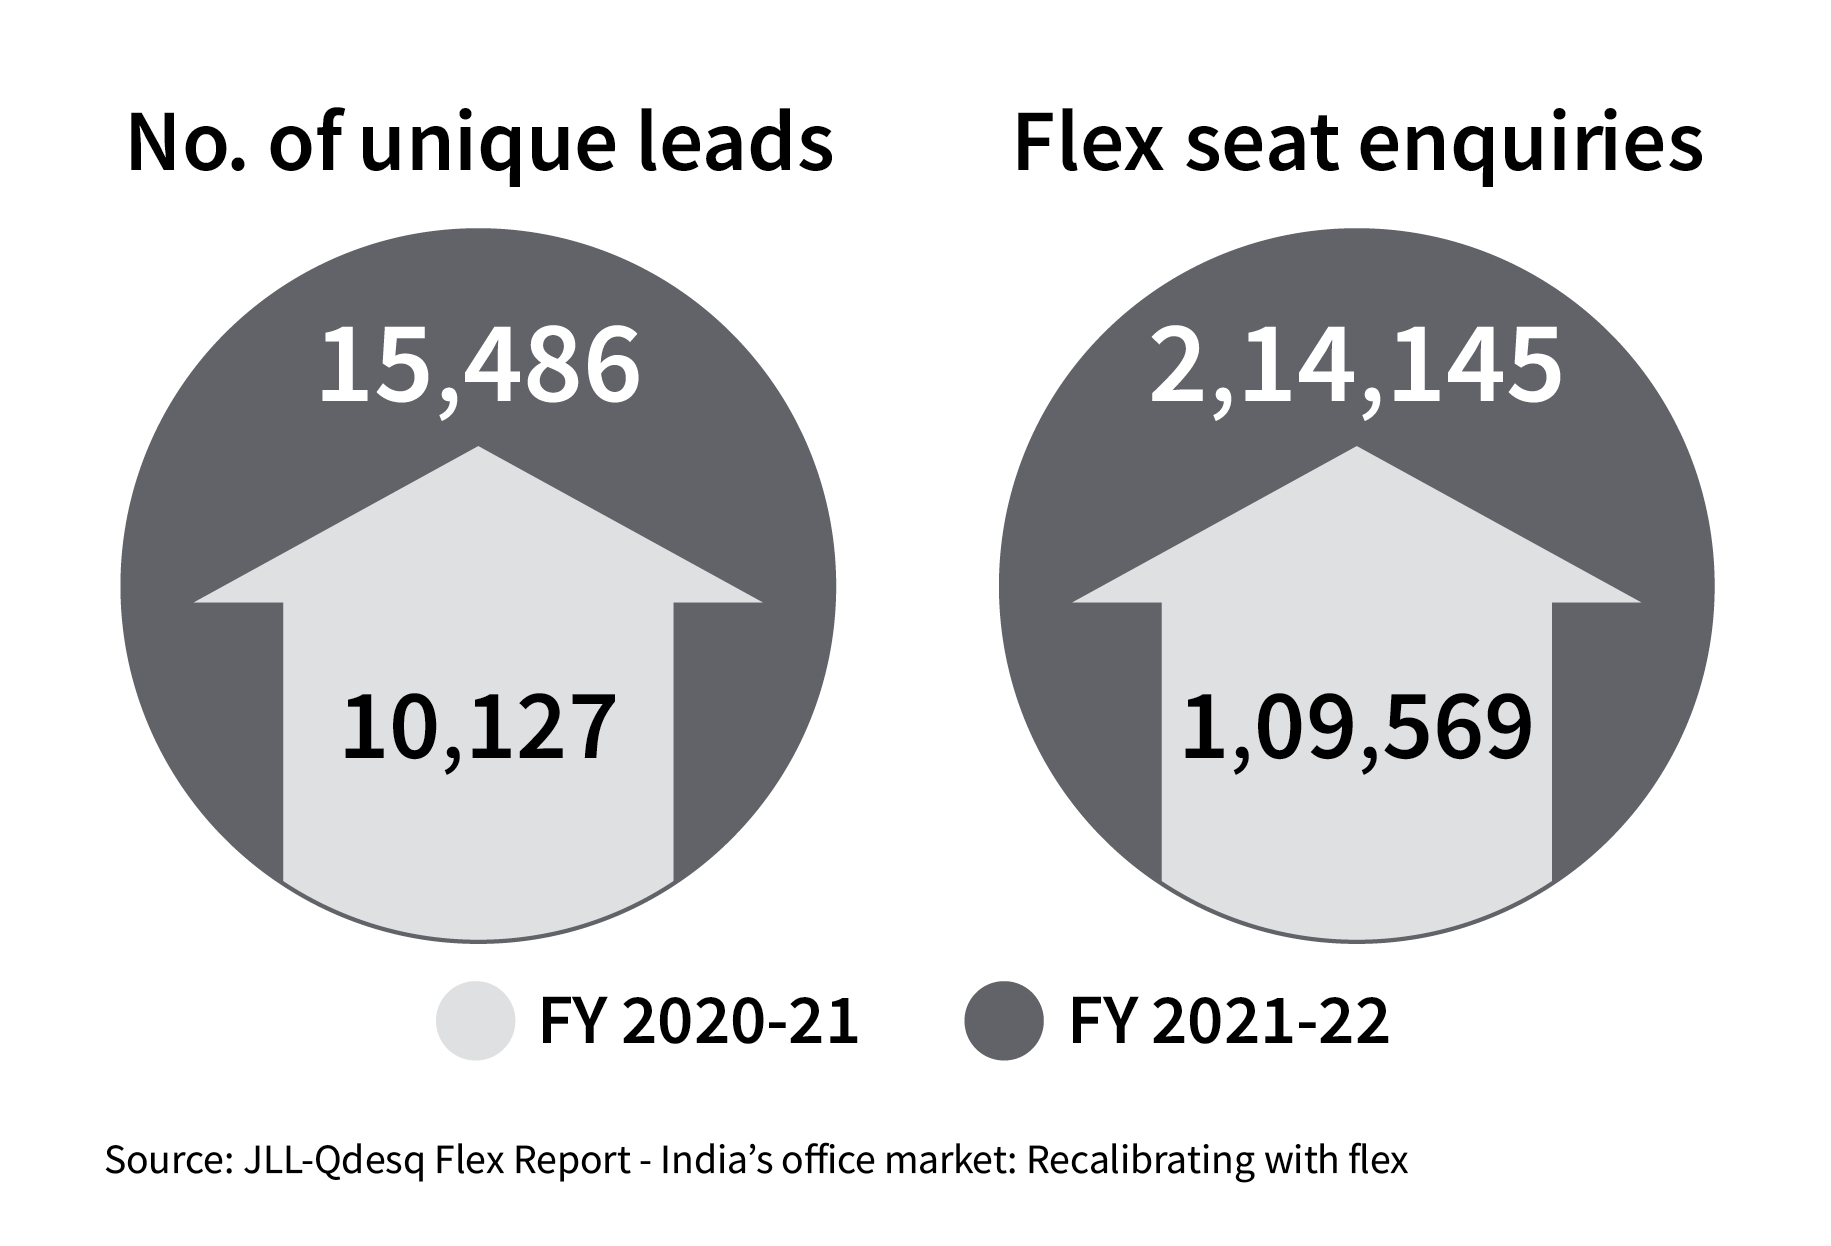
As per a joint report by Qdesq and JLL the aggregate enquiries for flex space witnessed nearly a 2X Y-o-Y growth for FY 2021-22. This translated to over 214,000 flex seats spread over 15,000 unique leads as recorded by Qdesq across the major Tier I and II cities. In terms of space, with 1 flex seat = 70 sq. ft of leasable area on an average, this translates to nearly 15 million sq ft.
Also, interesting to note is that the average deal size (number of seat enquiries/number of leads) has increased by around 27% - from an average of 11 seats in FY 2020-21 to an average of 14 seats in FY 2021-22. According to JLL 90,200 + flex seats were leased across the top 7 cities by occupiers in FY 2021-22 which is a 2.5X growth Y-o-Y. This shows that demand for flex space has seen a significant resurgence over the past 12 months, driven by enterprises seeking to create a more agile real estate portfolio strategy in an evolving hybrid work environment.
62% of the seats transacted were taken up through the managed route, where the flex operator was curating the entire flex workspace as per the tenant needs. This outlines how flex is transforming as per the needs of the market from a pure coworking set-up to a more private office, managed space concept. This is reiterated further with seat enquiries showing a higher demand for private offices (43%) compared to coworking set-ups (39%).
Delhi NCR, Bengaluru, Chennai and Mumbai, together lead seat enquiries
Delhi NCR leads in terms of unique leads and total seat enquiries. In fact, the top four cities in terms of seat enquiries – Delhi NCR, Bengaluru, Chennai and Mumbai, together account for about 74% of the leads and 72% of the seat enquiries, respectively. Bengaluru is the leading tech hub and along with Delhi-NCR forms the two major start-up clusters in the country and thus sees a significant demand also coming from big tech firms and well-funded unicorns
Flex seat enquiries up 17% Y-o-Y in Tier II cities
Start-ups, SMEs and companies in the fintech and e-commerce segments focusing on emerging economic centres and smaller towns for business growth and enterprises looking to tap into the talent pool of an increasingly mobile workforce are the mainstays of this rise in enquiries for flex seats in Tier II cities as per the report. Chandigarh, Indore and Lucknow are seeing robust traction for flex enquiries. In fact, there is good traction across major Tier II cities in the North, West and South.
More than half of the total flex seats leased in FY 2021- 22 were in the form of significant-sized transactions of 300 or more seats. In absolute terms, Bengaluru saw around 25,000 flex seats leased, followed by Pune with around 15,000 over the same 12-month period.
The aggregate enquiries are driven by ‘MSMEs & Others’ category across non-tech industries followed by tech and startups. These three segments together account for 59% of the flex space enquiries. JLL’s data on actual flex seat transactions shows that enterprises across a wide spectrum but led by tech and startups are now driving conversations around demand for flex and even actual space take-up. Tech and start-ups together contribute 48% of the actual flex space take-up.